The Bollinger Band Width(BBW) indicator displays the distance between the upper and lower Bollinger bands.
BBW is used as a measure of volatility. The Band Width value is higher when volatility is high, and lower when volatility is low. High Band Width values indicate that the current trend may be about to end. Low Band Width values indicate that a new trend may be about to start.
Developed by John Bollinger, Bollinger Bands are among the most popular trend identification indicators.
Calculation:
![]()
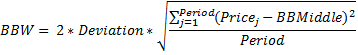
Deviation = Standard Deviation multiplier
Inputs:
Data Array = Close
Indicates Open, High, Low or Closing price.
Period = 14
Indicates time period(the number of days for daily analysis, the number of weeks for weekly analysis, etc.).
Moving Average Type = Simple
Specifies the type of Moving Average used for calculation of Middle Band.
Deviation = 2
The standard deviation multiplier used for calculation of Top and Bottom Bands.
Horizontal Shift = 0 (Valid only in MyChart.)
Used to shift the values backward or forward on the time scale.
Indicator Type: Volatility