The Stochastic Momentum Index (SMI) is based on the Stochastic Oscillator. The difference is that the Stochastic Oscillator calculates where the close is relative to the high/low range, while the SMI calculates where the close is relative to the midpoint of the high/low range.
The values of the SMI range from +100 to -100. When the close is greater than the midpoint, the SMI is above zero, when the close is less than than the midpoint, the SMI is below zero.
The SMI is interpreted the same way as the Stochastic Oscillator. Extreme high/low SMI values indicate overbought/oversold conditions.
- A buy signal is generated when the SMI rises above -50, or when it crosses above the signal line.
- A sell signal is generated when the SMI falls below +50, or when it crosses below the signal line.
- Also look for divergence with the price to signal the end of a trend or indicate a false trend.
The Stochastic Momentum Index was developed by William Blau and was introduced in his article in the January, 1993 issue of Technical Analysis of Stocks & Commodities magazine.
Calculation:
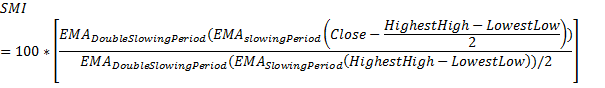
HighestHigh = The highest High in the selected period
LowestLow= The lowest Low in the selected period
Inputs:
K Period = 5
Indicates time period(the number of days for daily analysis, the number of weeks for weekly analysis, etc.).
K Smoothing Period = 3
Indicates smoothing time period.
Double K Smoothing Period = 3
Indicates double smoothing time period.
Signal Period (D Period) = 3 (Valid only in MyChart.)
Indicates signal line time period(the number of days for daily analysis, the number of weeks for weekly analysis, etc.).
Moving Average Type = Simple (Valid only in MyChart.)
Indicates Moving Average type of the signal line.
Indicator Type: Momentum